Technical Illustrations and Data Visualization
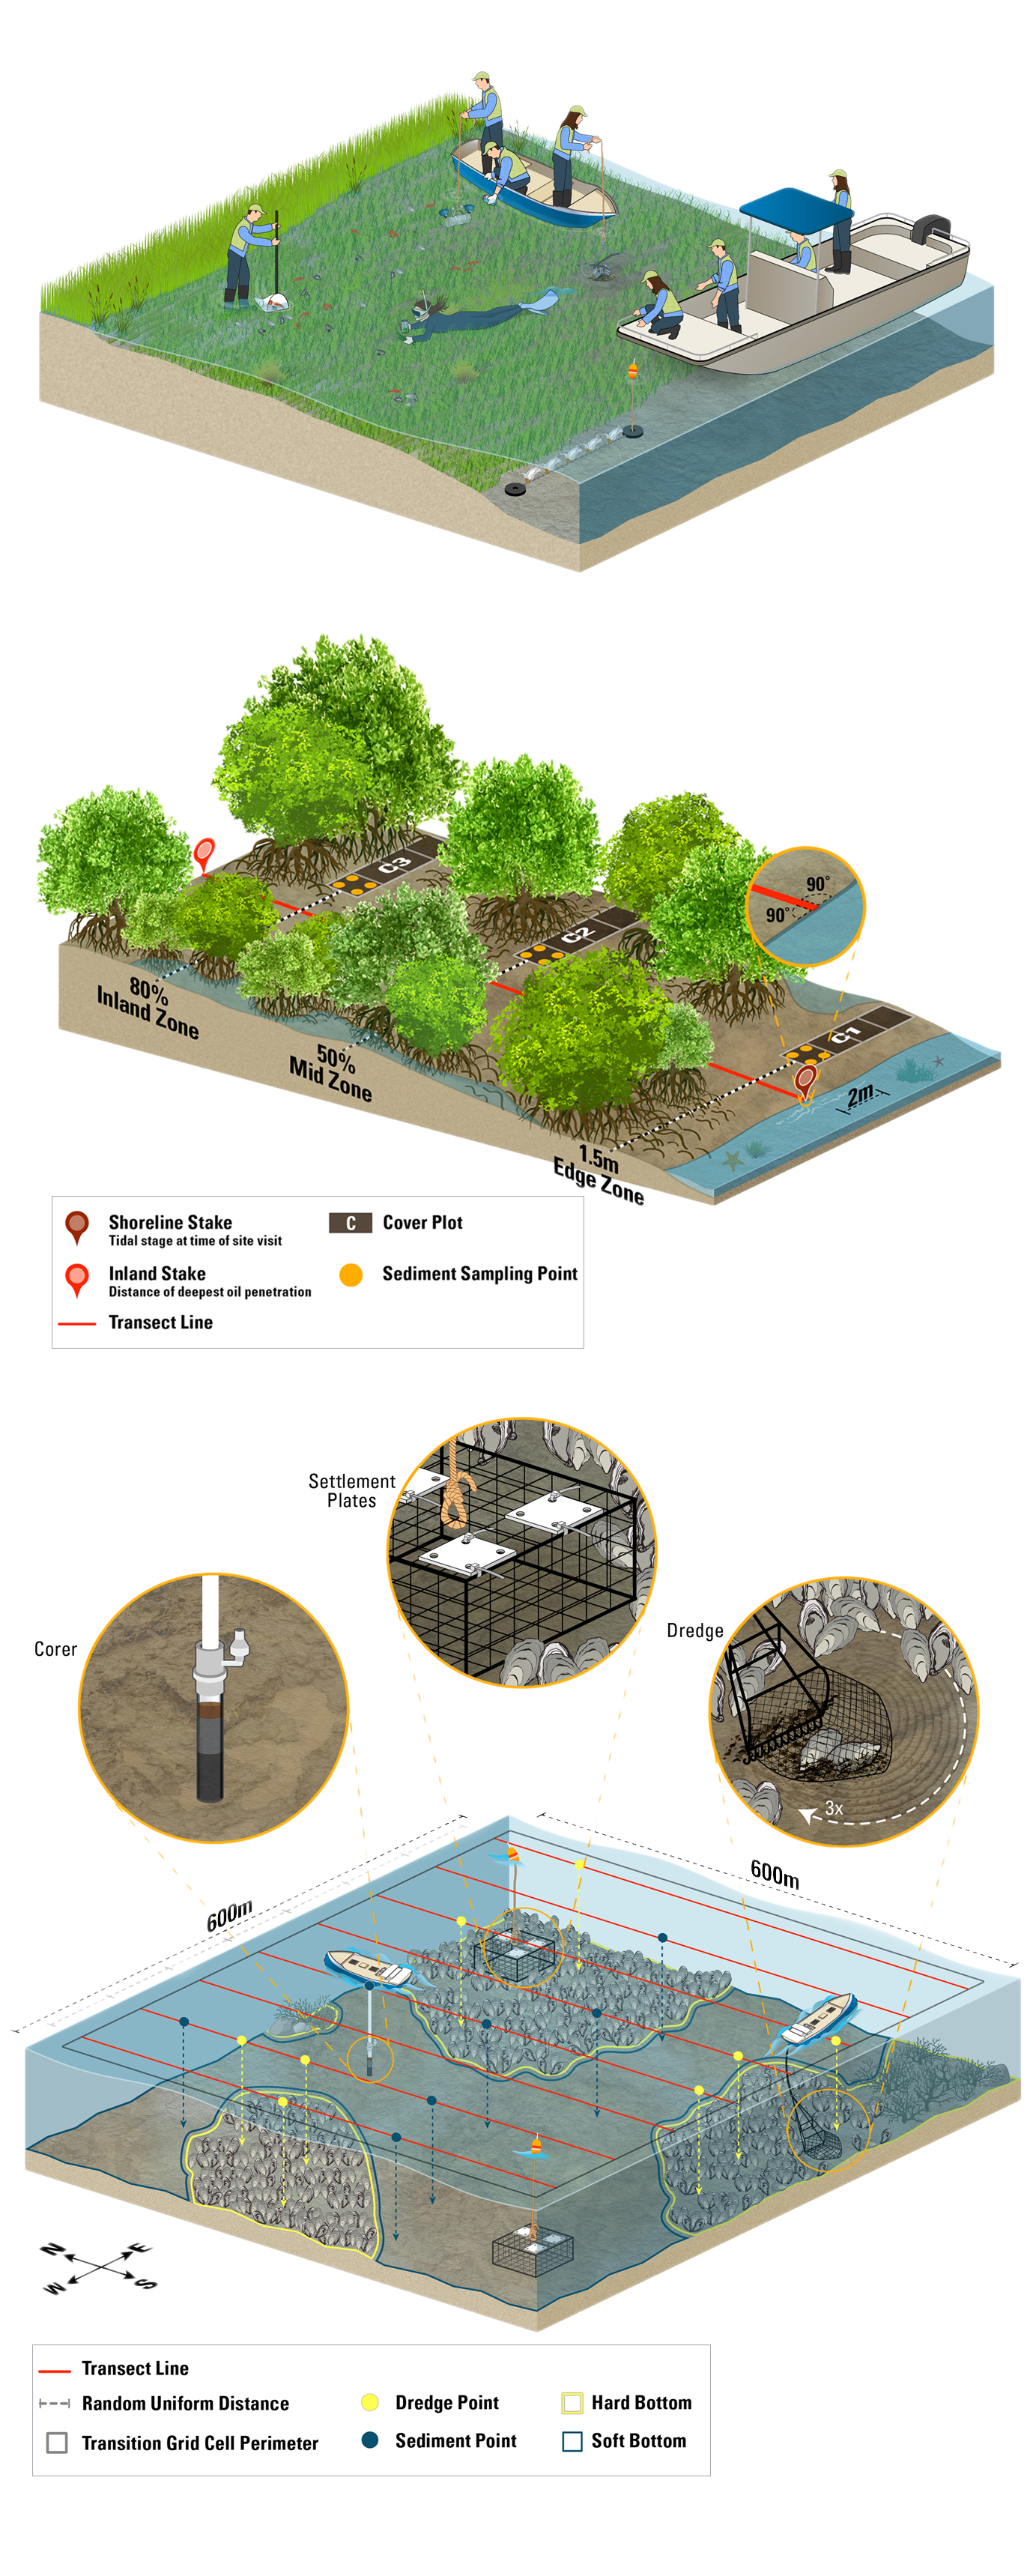
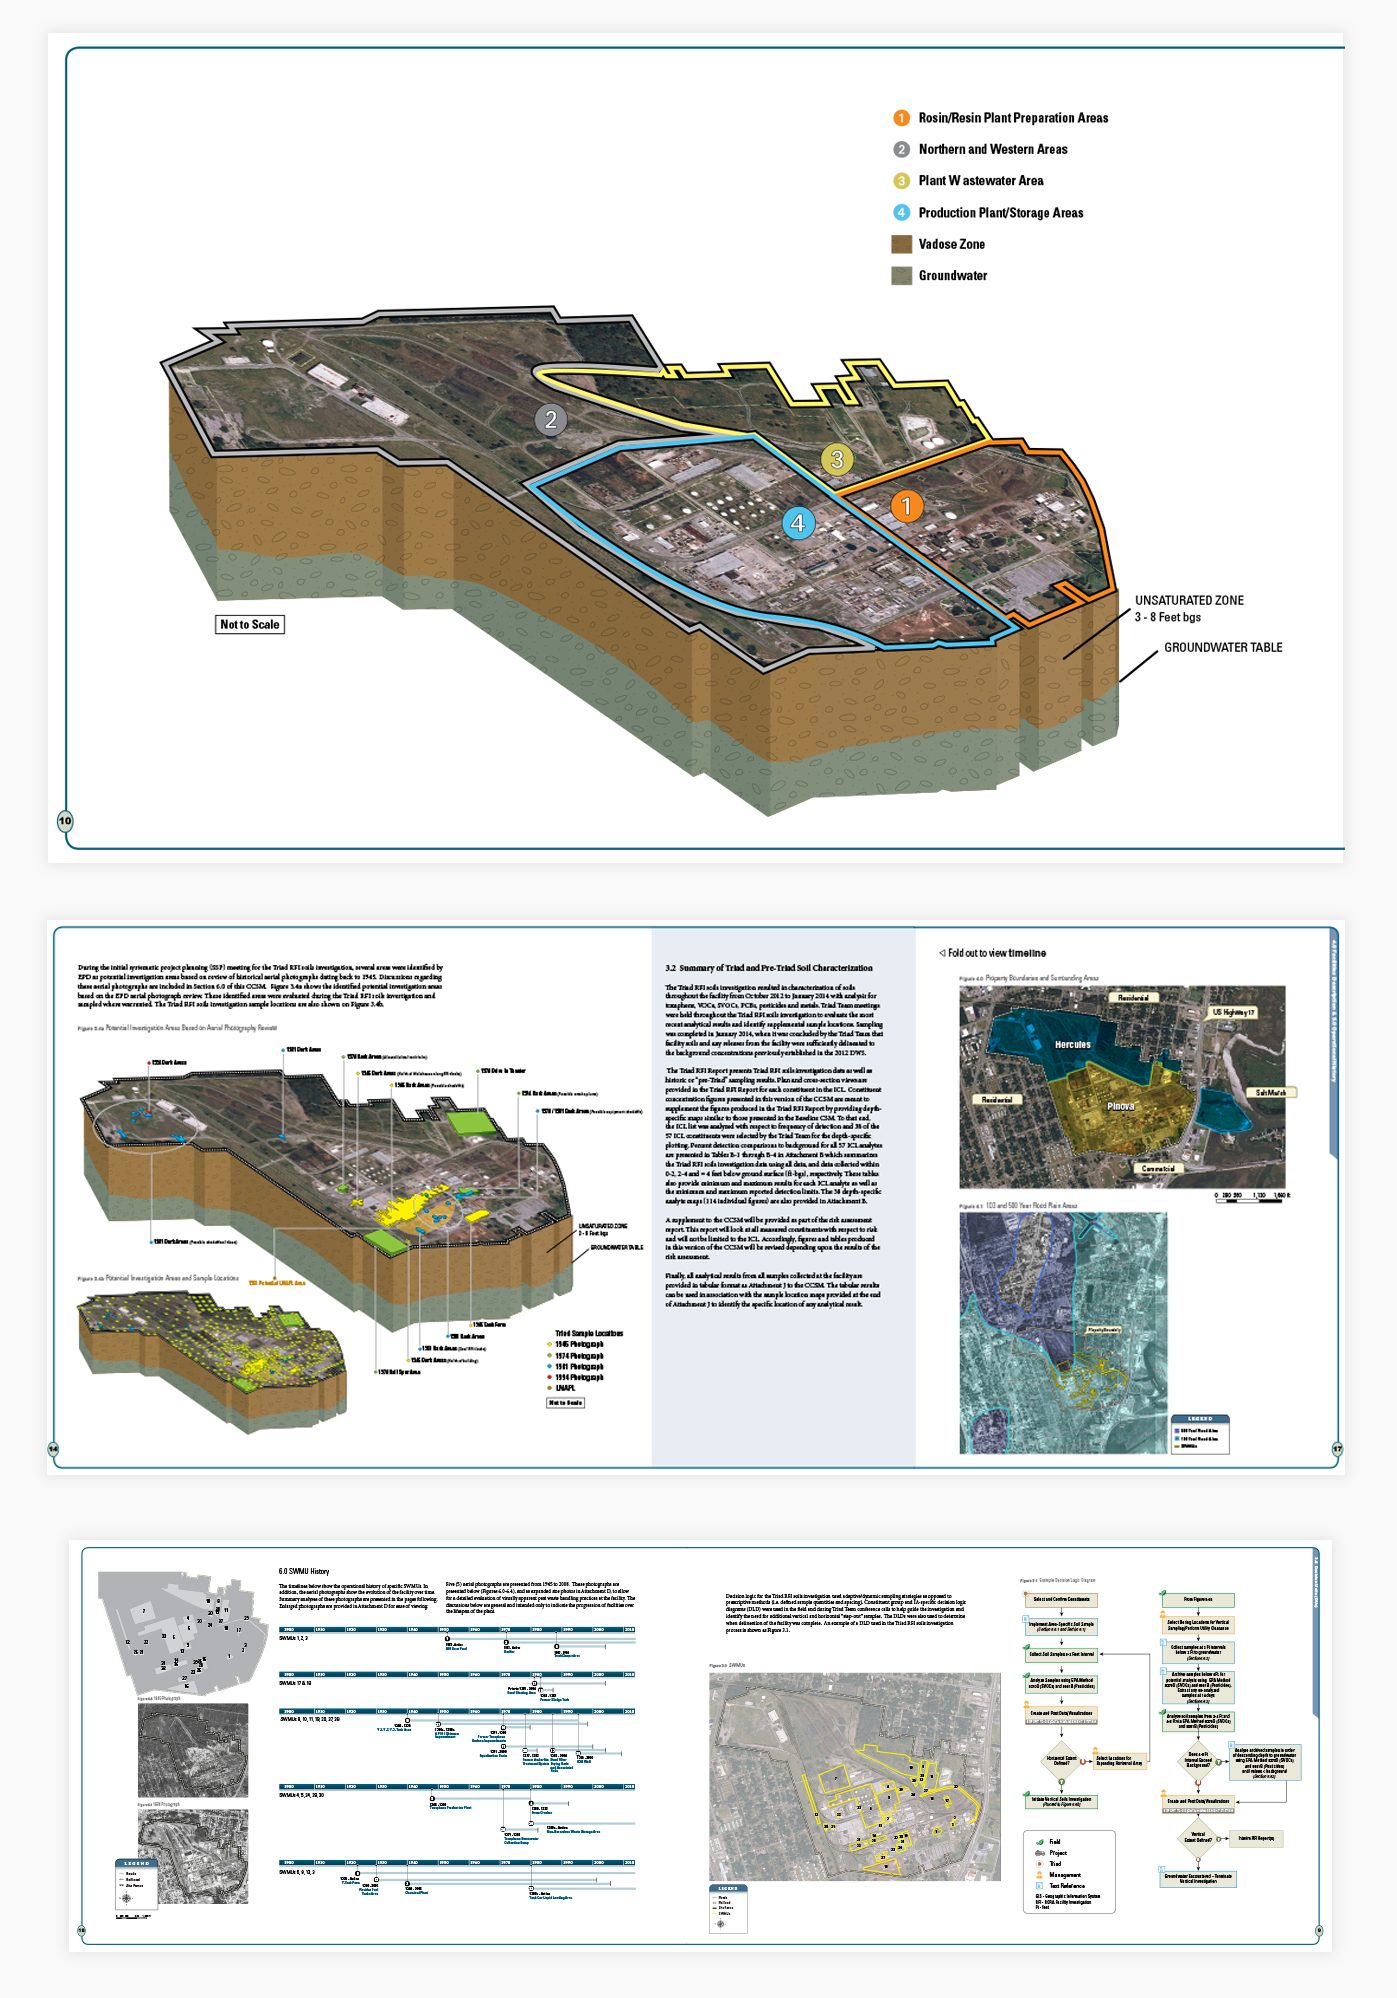
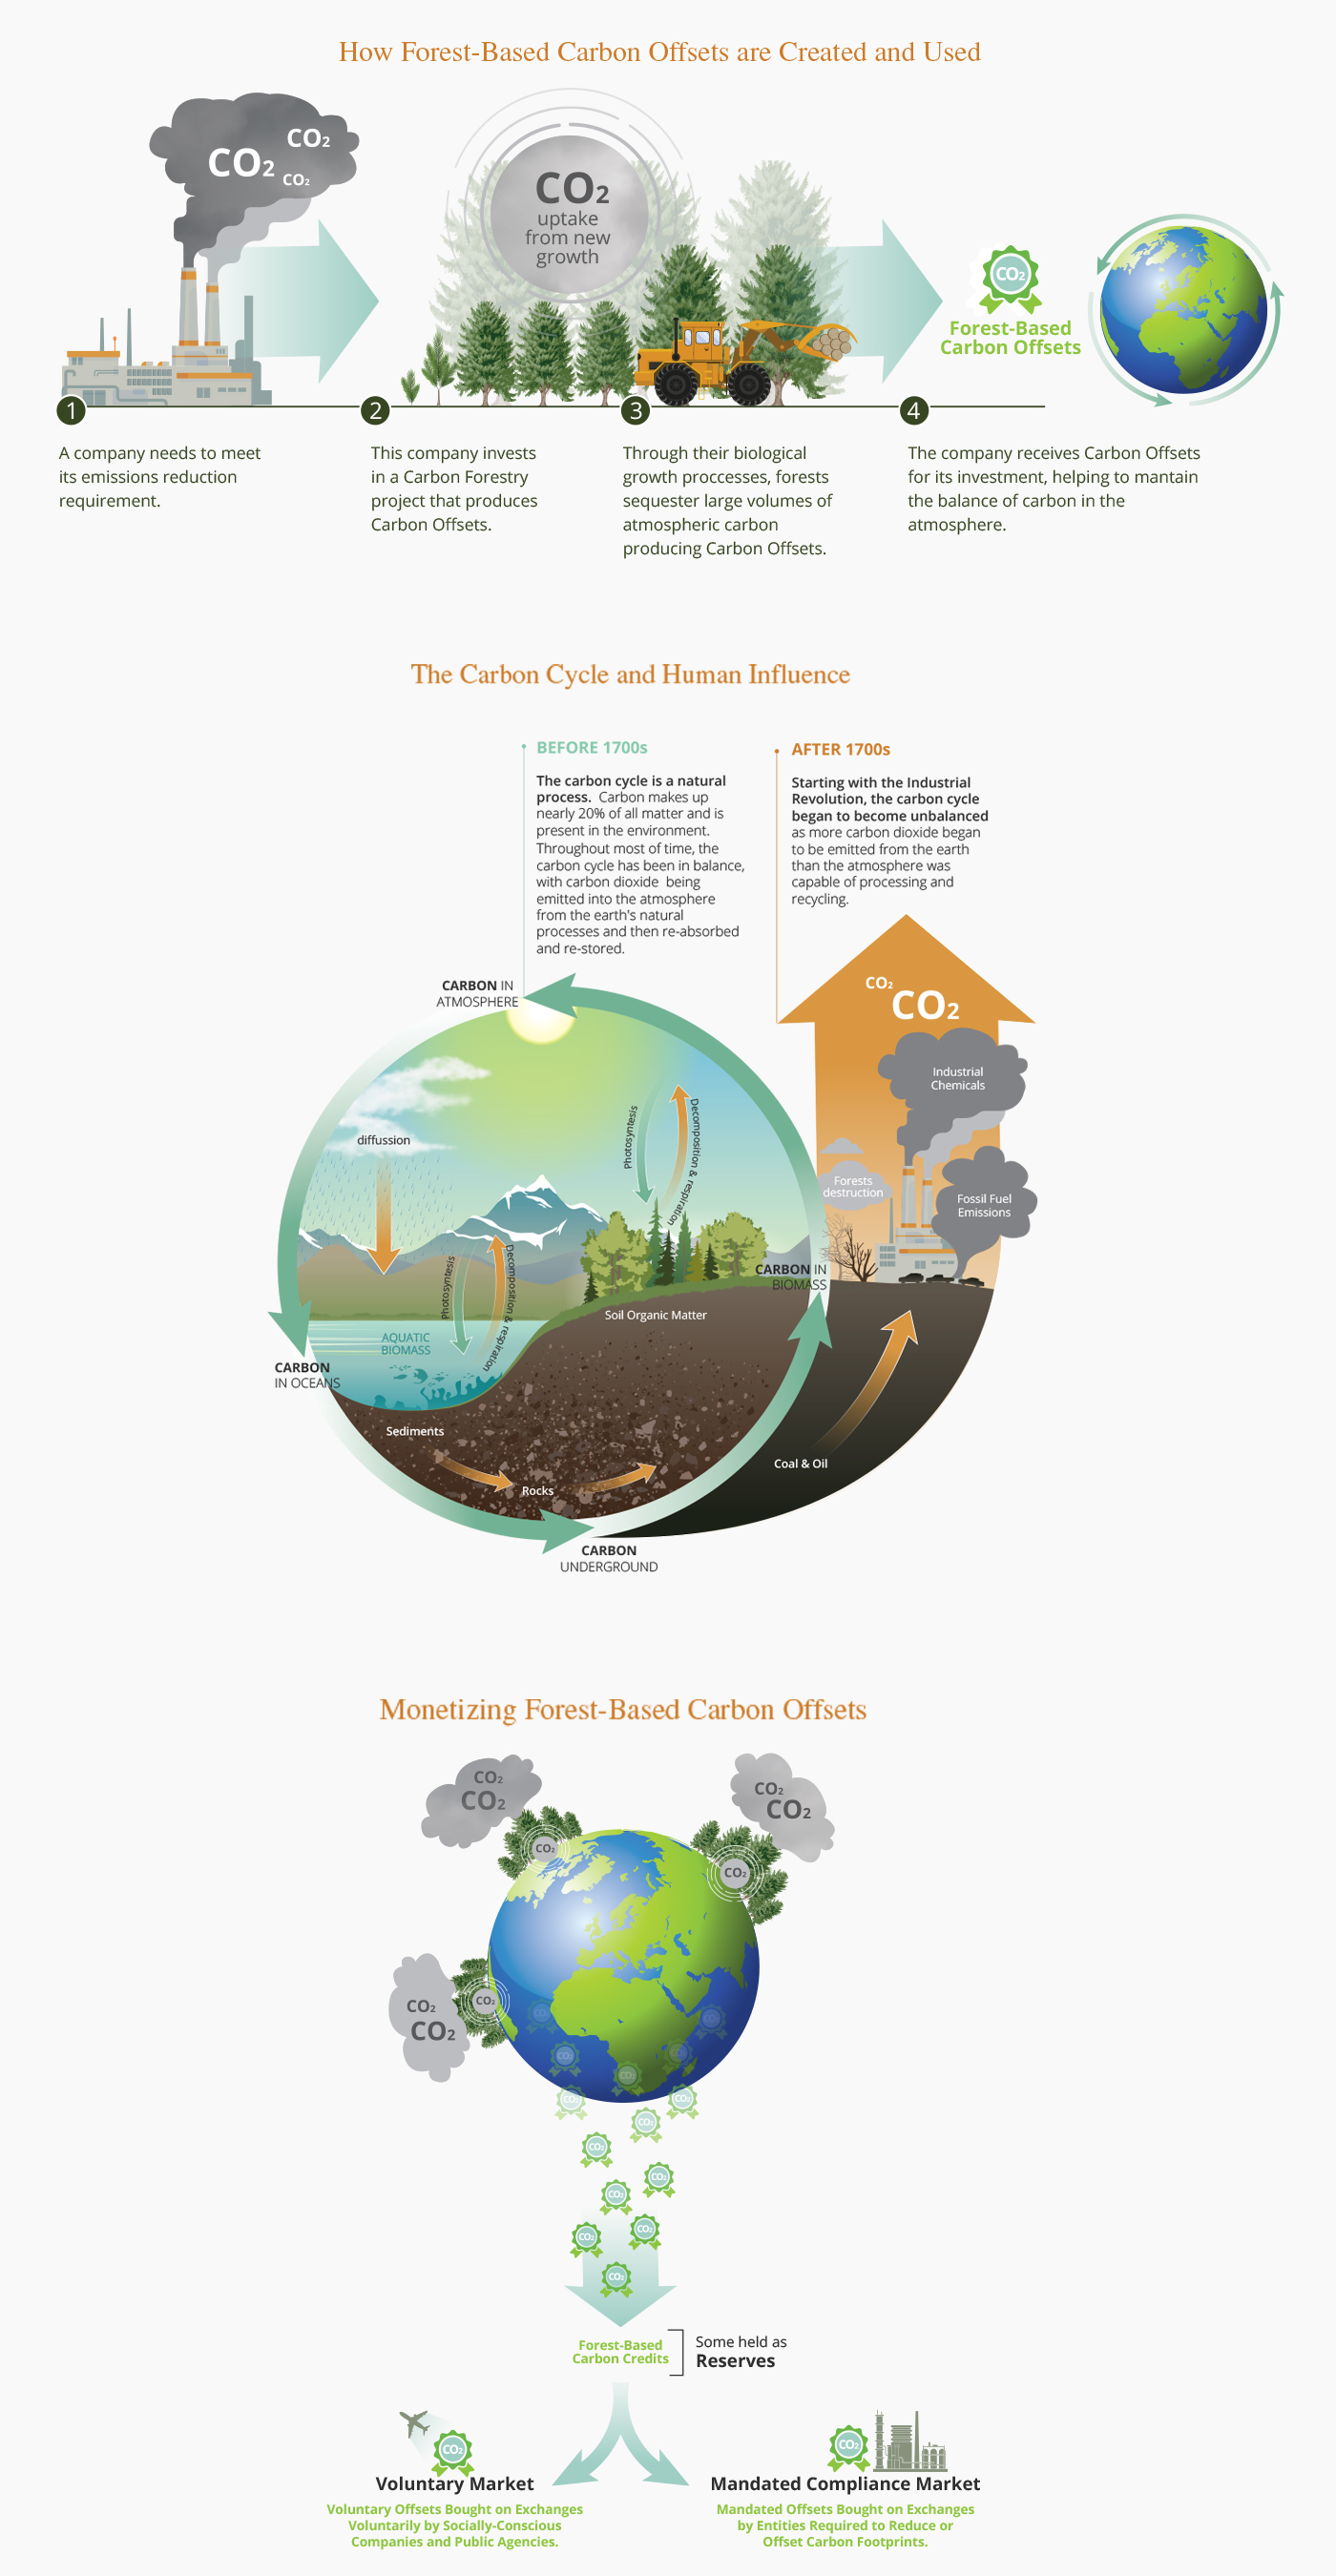
Technical illustrations, conceptual models, timelines of events, cross sections … these are just a few examples of our data transformation projects for environmental agency needs.
If we may modestly boast a few numbers of our own, we’ve done 250+ technical reports used in the USA, England, Brazil, Germany (Human Health Risk Assessment, Expert Reports, Data Analysis and Remediation Concept Reports, etc.), 50+ interactive animated platforms for expert witness and accompanying briefing documents and 250+ court demonstratives.
Our data visualization subject matter has spanned everything from oil spill sampling and underground contamination, to health risk assessments and cost evaluations, to a great many other diverse topics.


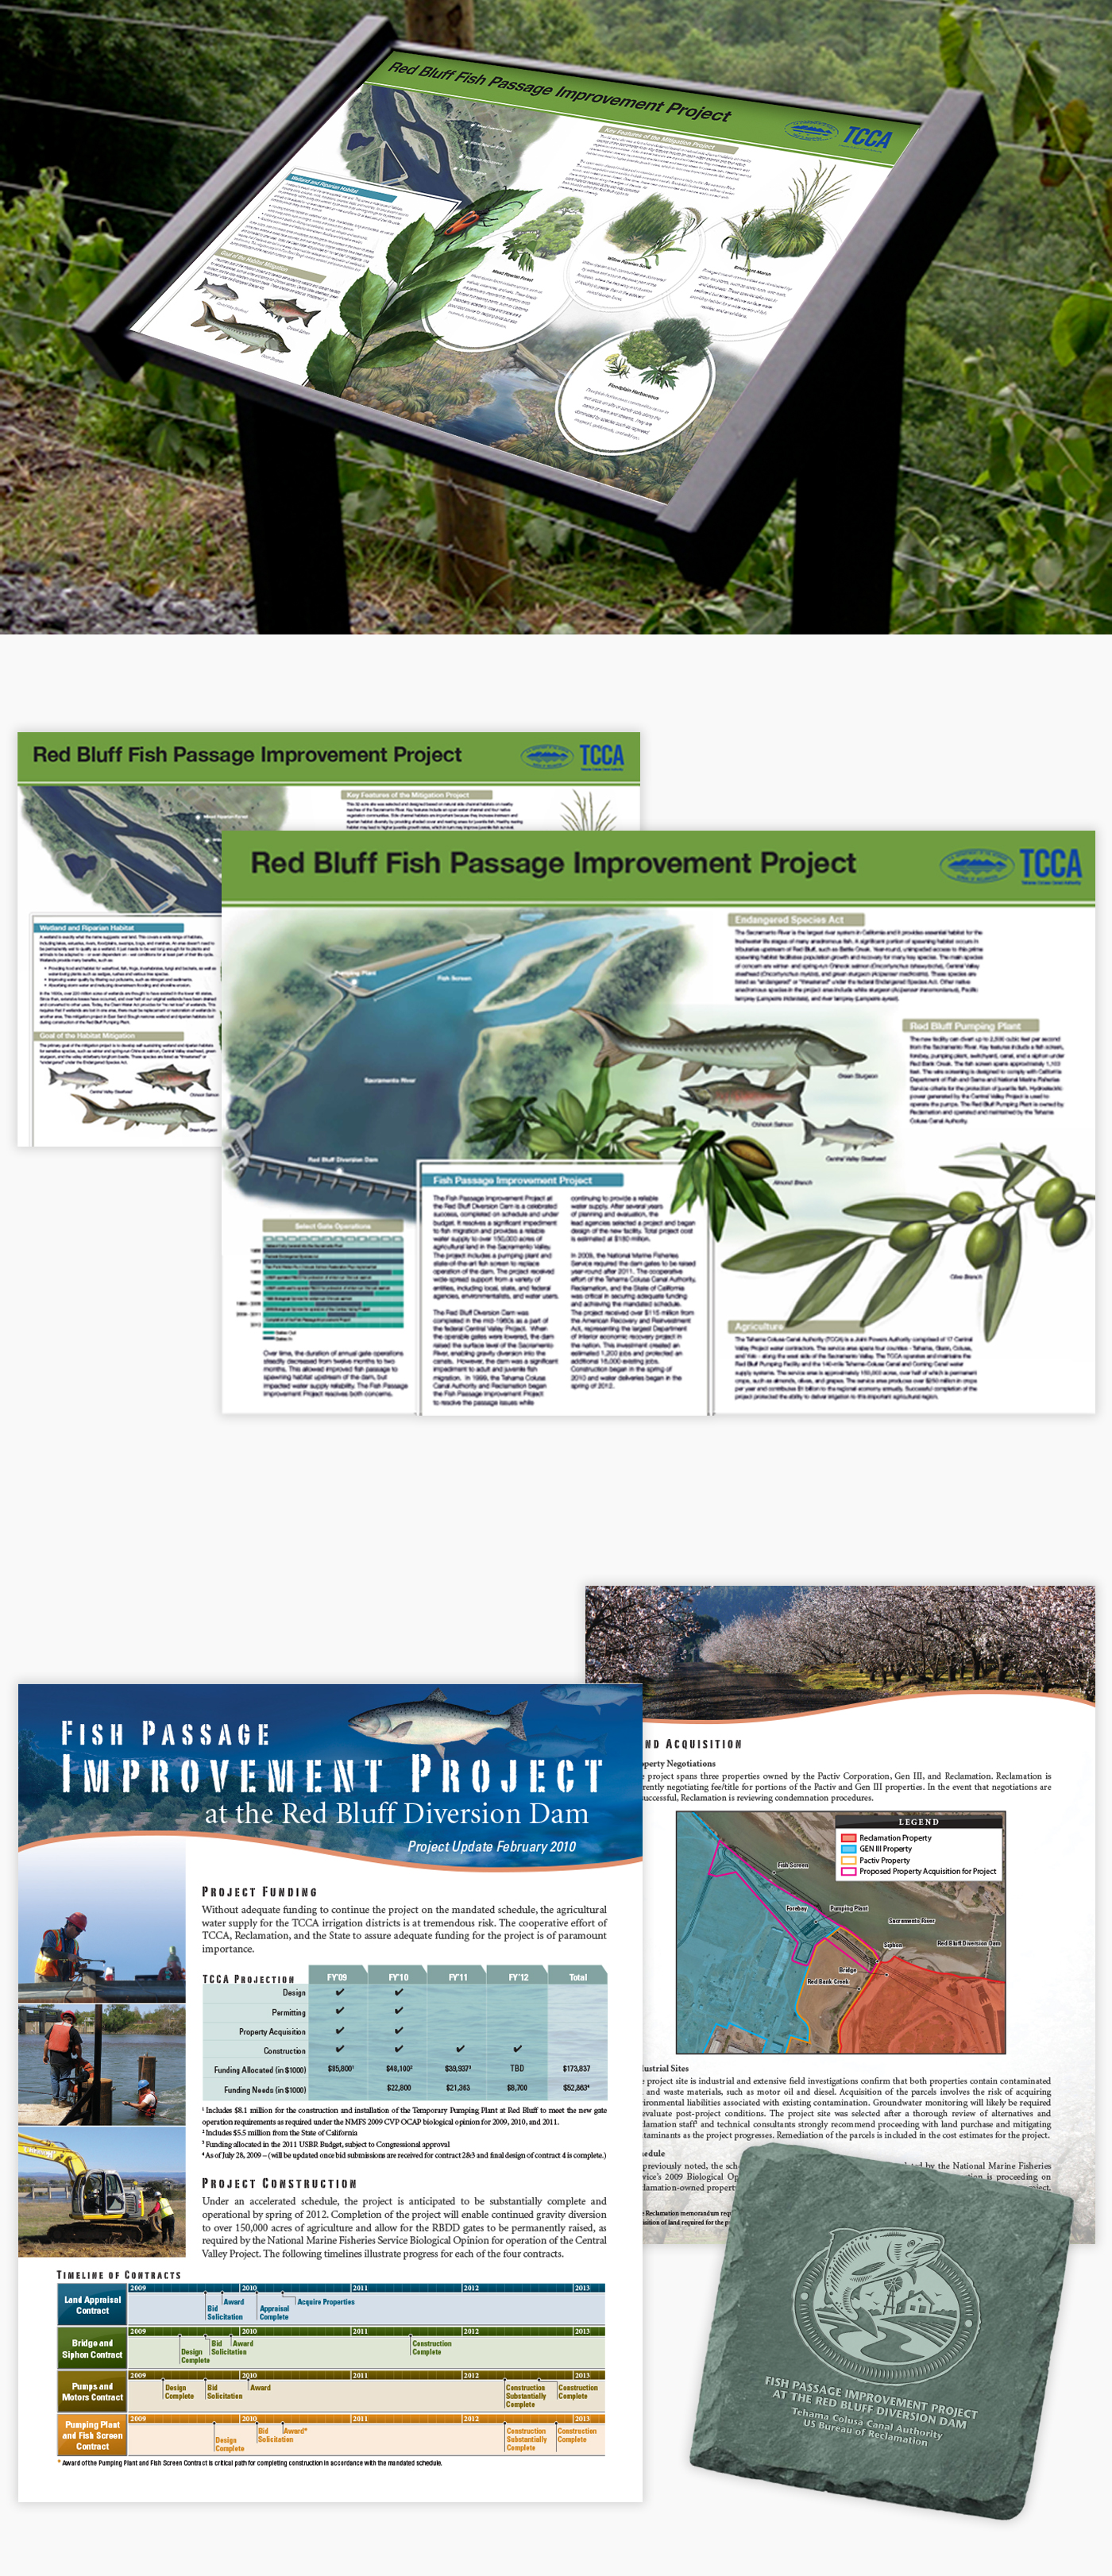
Interpretive Signage – Red Bluff Fish
We often find our design creativity pairing well with very specific requirements such as visual consistency across platforms and an intended multi-year life span. In this example of in-depth and wide-reaching public awareness materials, our creative team collaborated with subject matter experts at NewFields to produce the project’s informational brochures, conference materials, giveaways and interpretive signage.


